Abstract

Zoning is the DNA of a community's land use. It doesn't determine everything, but it's an underlying, coded blueprint for change, or sometimes the lack thereof. It affects a community's housing options, climate resilience, economy, public health, equity, transportation, emissions, and more.

Of course, these issues transcend local borders. In this sense, a city or town's zoning not only shapes the municipality's own future, but also that of its neighbors, and its neighbors' neighbors. For that reason, Greater Boston's larger challenges demand an understanding of land use regulations on a regional basis.

Yet the zoning codes of the 101 cities and towns of Greater Boston's are so complex, varied, hard to access, and bewildering that the only available regional data is decades old and incomplete.

MAPC's Zoning Atlas, a resource nine years in the making, is the first regional zoning map since 1999 and the first to include information about multifamily housing, residential density, commercial density, and overlay districts. Even more important, it is being published as a dynamic online resource that will improve over time as municipal staff and other contributors refine the data and provide updates. The public launch of the Zoning Atlas marks not the conclusion of the project, but the beginning of an initiative to build a comprehensive, community-driven inventory of land use regulations in Massachusetts.

Introduction


Massachusetts cities and towns have broad authority to regulate how property owners can use their land, and the requirements set forth in zoning codes have a profound influence on how communities change over time. While a municipality's zoning is not necessarily determinative of the development that is going to happen—there are many other influencing factors, such as septic capacity, health and building codes, and the vagaries of discretionary approvals—it is the most basic expression of the community's policies (and values) regarding land use and development.

It is also clear that changing land use regulations must be part of the solution for meeting the region's most urgent challenges: housing insecurity, residential segregation and inequity, greenhouse gas emissions, climate change vulnerability, and a struggling transportation system. Metro Boston has one of the tightest housing markets in the country, partly because so few municipalities have zoning that expressly permits multifamily housing. Meanwhile, municipalities that restrict multifamily development, or even denser development of single-family homes on small lots, remain exclusionary by race and unaffordable by income. The impacts of those choices reverberate well outside the boundaries of those communities, putting increased pressure on existing housing stock throughout the region.

Development patterns also influence how often and how far people drive. When zoning encourages growth in cities, town centers, and around transit, the resulting residents and workers are more likely to walk, bike and take transit, so they have a lower carbon footprint and contribute less to auto congestion. Of course, no one municipality can stop climate change, so municipalities must work together to mitigate greenhouse gas emissions and adapt to climate change, just as regions and nations must collaborate to address this global challenge.

Photo Credit:Amy Dain

However, this essential coordination across city and town boundaries can only be achieved if zoning and land use policies can be compared across multiple municipalities. Regional and state infrastructure investments and service delivery policies are predicated on forecasts of future growth and development. To serve as a reasonable representation of possible future conditions, these forecasts must reflect the underlying land use controls, which is only possible if there is some regionwide and spatially-explicit (that is, mapped) picture of zoning districts and their requirements.

In 2019, the Massachusetts Smart Growth Alliance published The State of Zoning for Multifamily Housing in Greater Boston, in which researcher Amy Dain examined the ways that municipalities in the region do or do not allow for development of multifamily housing in their zoning regulations. While it may seem, to someone not familiar with the intricacies of municipal zoning in Massachusetts, that it should be straightforward to understand whether a municipality does or does not allow for multifamily housing, the reality is quite different. Dain's research finds that although all but one of 100 municipalities1Dain did not include Boston in her analysis because it is already producing a tremendous amount of new housing, and because Boston operates under a completely different zoning statute from the rest of Massachusetts. in the region technically allow for multifamily housing, density restrictions, dimensional regulations, permitting requirements, discretionary permits, and other barriers are so arduous that it makes building multifamily housing very hard, if not impossible in most communities.

Dain's research also finds some common trends with respect to allowances for multifamily housing in recent years. In the last decade or so, more municipalities are allowing for modest amounts of mixed-use development in their town centers and around transit station areas; more are adding flexibility into their regulations that allow developers to build multifamily buildings through discretionary permitting processes. She also found evidence that many suburban municipalities are allowing and in some cases encouraging substantial amounts of multifamily housing in marginal areas at the periphery of the community, rather than in established areas or near town centers or transit. Furthermore, she found that municipalities are increasingly using discretionary review procedures (such as special permits or 'floating zones') for multifamily development, adding barriers that don't exist when zoning spell out clearly what is and is not allowed at a particular site.

Dain's research shed light on the myriad challenges the region faces in building the amount of housing it needs. She also highlighted the layers of complexity in the zoning codes and regulatory review processes required by municipalities. Her work raises critical questions not only about the extent to which cities and towns are making efforts to meet housing demand, but also whether they are taking active steps to address the racist and classist history of redlining and exclusionary zoning policies designed to keep out less-wealthy residents and people of color. In short, it appears that few communities are doing so, but the full picture has not been drawn.

MAPC's Zoning Atlas adds a critical resource to the conversation: an electronic zoning database that can not only map the boundaries of the nearly 2,000 zoning districts in the region along with their allowable uses, but also accept updates and improvements from municipal staff so it will evolve over time. The data in this atlas can be used by municipal staff to understand how their zoning compares to that of their neighbors, by researchers to begin to answer questions about development in the region, by MAPC to create more accurate land use projections to guide infrastructure investment, and by advocates to shed light on municipalities in the region that hold onto exclusionary restrictions.

It is our hope that the zoning data we have collected, standardized, and made available are used for all of these purposes and more. It is also our hope that the municipal staff who steward their own official zoning boundaries and codes will help us keep this atlas as current and accurate as possible. Our findings and observations should also serve as a call to action for those interested in transparent, efficient governance, as there is much more that could still be done to improve access and comparability of zoning data.

The Basics of Massachusetts Zoning


There are two distinct elements to municipal zoning. First is the zoning map that defines the geographic extent and precise boundaries of the zoning districts; second are the municipality's zoning bylaws (for towns) or ordinances (for cities) that detail, in narrative form, the allowable uses, dimensional restrictions, design requirements, and other regulatory aspects of each district.

There are also two different types of districts: base zoning districts and overlay districts. Base zoning districts cover the entirety of a municipality without overlapping each other. Overlay districts, as their name suggests, overlap base zoning districts (and sometimes each other) to add further detail to or change regulatory specifics of the underlying districts. Overlay districts don't have to cover the entirety of a municipality, and in fact, some municipalities don't have any overlay districts at all. Some overlay districts provide more flexibility in development or allow higher density; others restrict development in a particular area to protect valued environmental or cultural resources; and some are narrowly targeted districts for specific uses, such as telecommunications or adult uses.

Zoning also speaks to what landowners may do with their property without official review, and what they can only do at the discretion of a deciding authority. Kinds of uses and intensities of uses that don't require further review are referred to as "by right" or "as of right" uses. Pursuing a project allowed by right in a particular zone is the most straightforward pathway for development, as long as the proposal is strictly consistent with the zoning requirements. A proposal that conforms to the zoning code can generally proceed directly to the application for a building permit without needing approval from a planning board or other regulatory body.

On the other hand, discretionary processes take many forms and create many opportunities for a proposal to be blocked, sometimes permanently. They may add considerable complexity to a development process, while also ensuring the municipality has more control over a particular proposal. Special permits have to be reviewed and approved by the appropriate regulatory body (the Special Permit Granting Authority, or SPGA) in the municipality. This may be the planning board, the zoning board of appeals, the city council, or another designated municipal entity.

Special permits may be required for a particular use or dimensional flexibility within a zone, or they could apply to all development of a certain type or in a specified overlay district. However, property rights law requires that zoning must permit some economically viable use of each parcel on a nondiscretionary basis. In other words, for every parcel and base zone, there must be some form of allowable development that does not require a discretionary permit.

In addition to the complexity inherent in zoning bylaws and ordinances themselves, there are often logistical barriers and planning and permitting processes that further restrict what is built. Such procedural mechanisms are many. For example, regulatory requirements, such as state wastewater disposal regulations, the Wetlands Protection Act, or local wastewater or wetland regulations may preclude a site from being developed to the maximum amount permitted by zoning. Or mitigation requirements or community benefits agreements may render higher density developments financially infeasible.

Discretionary processes may allow a municipality to reject a proposal otherwise largely consistent with the zoning code. The result is that what is built on the ground does not always reflect the written policy in the zoning bylaws or ordinances. As a result, even in districts where zoning nominally allows multifamily development, it is often rare due to the obstacles presented by other regulatory factors.

History of the Zoning Atlas


The last time there was a coordinated effort to compile and standardize municipal zoning data in Massachusetts was in 1999, when the Massachusetts Bureau of Geographic Information (MassGIS) created a statewide GIS map of so-called 'base zoning' and compiled information from the bylaws or ordinances of each municipality in the state (with the exception of Boston). MassGIS standardized information from the codes to allow for comparison across municipalities and to provide a regional overview of allowed uses.

Photo Credit:Alex Koppelman

The data were also used to develop 'buildout' analyses that estimated the total number of units that could be built on undeveloped areas under base zoning. Since that 1999 release, the need for regional zoning data has arisen in MAPC's work numerous times and has been requested by municipalities and other organizations with whom we collaborate.

A regional zoning map was one of the ten "Most Wanted Datasets" MAPC identified in MetroFuture: Making a Greater Boston Region, Metro Boston's 2008 regional plan. As an agency in a unique position to serve as a data intermediary for the 101 municipalities in our region, and that has the capacity to take on a large regional dataset collection and publication project, MAPC took on the project in 2011.

At the outset, it was clear that the Atlas should not only update the 1999 zoning map, but should include additional features, including the interpretation of multifamily housing restrictions, overlay districts, online interactive mapping, and mechanisms for feedback and updates. In order to inform the data collection and design the data format itself, MAPC consulted an advisory group consisting of municipal planners, state agency staff, and other stakeholders. The input from this advisory group was used to define a data schema and guidelines for interpreting local codes.

MAPC began the data collection in 2012, but the work was hampered by municipal nonresponse as described below. The task of compiling spatial district boundaries and interpreting the bylaws proved to be much more complex than anticipated. Due to budgetary restrictions, MAPC was able to dedicate staff to the project only on an episodic basis in the subsequent years, and the data collection proceeded slowly. The launch of MAPC's current regional planning effort MetroCommon 2050 created the opportunity to renew work on the zoning data collection and complete the first iteration of the Atlas.

The Zoning Atlas will always be a work in progress. Its first release in December 2020 is a foundational dataset that can be updated and improved over time and with the contributions of municipal staff and other stakeholders. Municipal zoning boundaries and codes are living documents, and it is our intention that the Zoning Atlas will evolve as municipalities update their zoning.

The Atlas will also improve as attributes and interpretations are refined by stakeholders. Because the restrictions of a zoning code are contingent on both site conditions and interpretation, there is often no definitive value for a particular metric. As a result, the attribute values in the Atlas represent only an approximation of how complex bylaws and ordinances are likely to be applied. Where our interpretations are incorrect, stakeholder contributions will be critical to building a robust and accurate database.

Creating the Regional Zoning Map


Since there is no central repository for municipal zoning data, MAPC contacted representatives of every city and town in the region to request both electronic versions of the zoning map (in GIS format2The GIS data that municipalities create to display their zoning districts on digital maps do not necessarily represent the official boundaries of each district; often, those boundaries are delineated with narrative descriptions in the zoning code.) and bylaws or ordinances. The initial round of outreach demonstrated the wide variety of ways that municipalities store and share their zoning information. Some cities and towns publish their zoning district maps as a PDF map on their website; others publish it via an interactive web map; and a few make the GIS data available on their open data portal. Many municipalities employ a third-party consultant to develop, edit, and store their spatial data. In some cases, the only way to view a zoning map was by way of a paper copy accessible in town hall.

The responsiveness of municipalities in response to our request for zoning data was uneven, at best. Despite our role as a regional agency, many municipalities were slow to respond or resistant to sharing their zoning data – and there is evidence that we received more favorable treatment than members of the general public. (A research effort conducted in 2011 by former MAPC staffer Robert Goodspeed found that, in response to public records requests for digital zoning or parcel data, more than half of responding municipalities charged for the data, in some cases as much as $450). Many others provide it with questionable licensing or reuse restrictions, including extensive data use agreements and prohibitions on redistributing the data. Others simply refused to provide existing electronic copies of the data in response to the request, claiming they were exempt from public records law.

We were also fortunate that MAPC works with the region's municipalities regularly on projects that require referencing municipal zoning data, and for those projects municipalities share their zoning shapefiles directly with us.

Despite our best efforts, the Atlas still is missing up-to-date electronic zoning data for more than a dozen cities and towns. We were simply unable to gain access to data for ten municipalities, though we have reason to believe that updated spatial data exists. An additional six municipalities in the region have made changes to their zoning without corresponding updates to their GIS data. For these municipalities, the Atlas includes the boundaries published by MassGIS in 1999. Using these methods, we were able to create a mosaic of base zoning for all of the cities and towns in the MAPC region.

Collecting spatial data for overlay districts adds additional complexity, as not every municipality has overlay districts, and some have many. We focused our efforts on collecting overlay districts that affect the allowed density of development, whether through allowances for higher density, or restrictions reducing it.

To-date, we have collected overlay district spatial data from 56 municipalities on 260 overlay districts. We have supplemented these overlay districts with spatial data delineating 40R Smart Growth Zoning Overlay Districts, which were provided to MAPC by the Department of Housing and Community Development (DHCD) in March 2020. DHCD's 40R spatial data is current to 2017. The 40R districts have provided partial overlay data for an additional four municipalities and 12 overlay zones where we didn't previously have data.

Photo Credit:Alex Koppelman

Collecting and Interpreting Zoning Codes


Zoning ordinances and bylaws have a similarly wide variety of formats and access pathways. Some municipalities publish their zoning bylaws or ordinances as PDFs on their websites (sometimes machine-readable, sometimes scanned), and others use a web platform designed for publishing municipal codes, such as eCode360 or municode. One municipality publishes their codes as a Word document. While some of these formats make data interpretation and extraction for a third-party such as MAPC easier than others, the many variations in form, not to mention content, slowed down our collection process.

In order to collect the information about allowed uses and dimensional restrictions for each zoning district, MAPC reviewed the most current available zoning bylaws and ordinances for every municipality in the region. Before interpreting the code ourselves, we contacted municipal staff in each city and town to solicit their interpretation. That process entailed sending a table pre-populated with known districts, all desired fields, and attribute values from the 1999 MassGIS data, where available. For those municipalities that provided us with data, we used their interpretations as the basis for ours, and then augmented with a review of their most recent code. As with the collection of electronic zoning data, the municipal response to our request was spotty. Most of the fields were populated through MAPC interpretation.

Each municipal zoning bylaw or ordinance, for the most part, covers the same basic information. Elements include allowed uses, multifamily allowances, setbacks, minimum lot size. But there is a wide range of ways the information is presented in the written zoning code, and variety in the specific form and use measures that are regulated. Some codes provide data tables that contain the same regulatory fields for each district in the municipality (see Image 1), while others provide a narrative description or bulleted list for each district (see Image 2). Meanwhile, some codes include regulations both in a table and as part of the narrative. Even the nomenclature varies: some codes present "dimensional standards," others a "schedule of dimensional requirements" or a "table of intensity regulations," and so forth. This variation in naming makes it difficult to even search for the relevant information in a zoning ordinance or bylaw.

In addition to the variety of zoning code formats, there is a multiplicity of approaches to how development is regulated. For residential districts, some municipalities set forth a minimum lot size for each home or unit; others specify a maximum number of units per acre. Most municipalities establish certain requirements for setbacks, frontage, lot widths, and other dimensional measures. Even within a district, the effects of such requirements are not equal across all properties, since their relevance and application depends on lot shape and configuration. For example, setback requirements have a greater impact on narrow or irregularly shaped lots than on those that are more equilateral.

For multifamily housing, mixed use, and commercial districts, the approaches are even more varied, often including some combination of height limits, lot coverage limits, open space requirements, setbacks, and (rarely) direct regulation of the floor area ratio (FAR). To add to the complexity, the way these metrics are calculated changes from municipality to municipality. Different codes present different methods for calculating percent lot coverage, height, applicable floor area, and so forth. Even the definition of something as basic as 'lot area' is nonstandard and may exclude wetlands and floodplains in some municipalities or districts but not in others.

Complicating the patchwork of approaches and regulated metrics is the wide variety of exceptions or use-specific regulations. Some codes set different standards for an individual zone based on the proposed use (see Image 3). Others have specific requirements based on location for example, for parcels abutting another district, roadway type, or resource area. In some cases, dimensional requirements are a function of the proposal itself. They are based, for example, on FAR with respect to proposed height (see Image 4), or minimum lot area per unit with respect to number of units.

These exceptions can be quite numerous and overlapping—in one case a single zone had no fewer than 58 footnotes describing specific exceptions or edge cases. There are also zoning standards such as minimum parking requirements that serve as a de facto limit on density even though they do not do so explicitly.

Finally, the region's zoning codes are riddled with options that require discretionary approval by a designated authority, whether for a particular dimensional flexibility, use, parking requirement, or other standard. Again, the special permit requirements may only apply in particular cases within a zone, so determining what is permitted 'by right' is not even straightforward within a single zone for a single use. While this discretionary process is important to recognize because it influences a great deal of development that occurs in the region, it is so complex and unpredictable that it is not feasible for us to capture the many variations it adds to the data.

Decorative triangle

Image 1

Example municipality's e360 dimensional restrictions table

Image 1

Decorative triangle

Image 2

Example municipality's MuniCode dimensional restrictions description for residential districts

Image 2

Decorative triangle

Image 3

Example municipality's dimensional requirements that vary by use

Image 3

Decorative triangle

Image 4

Example municipality's dimensional requirements that vary by height

Image 4

Data Framework for the Zoning Atlas


All these complexities demonstrate that the task of precisely determining what uses are permitted in a given zone and at what intensity is difficult, if not impossible. Nevertheless, the purpose of the initiative was to develop metrics comparable across all municipalities.

For the purposes of our Zoning Atlas, therefore, MAPC defined a basic set of "core fields" covering use allowances and dimensional requirements and set out to collect that information from the zoning codes. Those core fields are as follows:

  • Minimum lot size
  • Dwelling units allowed per acre
  • Maximum height
  • Maximum floor area ratio (FAR)
  • Whether multifamily housing was a permitted use, and if a special permit was required

For ordinances and bylaws that regulate development using different use and intensity metrics, we had to estimate the desired value based on other fields available in the code. In some cases, we even had to estimate the fields we used to calculate our core fields. (The details of this process are included in the technical appendix.) Where there were multiple uses or intensities allowed, our approach was to code districts according to the densest use allowable without a special permit, in order to provide an 'upper bound' estimate of by-right development potential.

The challenges of interpreting overlay districts, especially those that permit greater flexibility and increased density, is even more complex than the task for base zoning. These districts often include even more requirements and discretionary review processes that tend to obscure, rather than define, the likely development potential on a given site. MAPC has not yet attempted to interpret or standardize the allowable uses and densities in these districts. For now, we have settled on classifying them into three types:

  • Flexible Districts, which generally relax the density and dimensional requirements of the underlying zone. Examples include overlay zones that allow multifamily housing or mixed-use development in places where it is not permitted, or that permit flexibility in site design.

  • Restrictive Districts, which limit development potential so as to protect natural resources or other assets. Examples include floodplain overlay districts and historical preservation districts

  • Special Districts, which have targeted application to specific, often legally mandated uses. Examples include telecommunications, retail cannabis, or adult-use districts.

This point bears repeating: by no means is the Zoning Atlas a definitive and comprehensive representation of precisely what development allowed in a given zone. Indeed, it is not clear that any such definitive representation is even possible, given the complexities we have described above. The full significance of zoning can only be determined as a project moves its way through the regulatory process and is evaluated by regulatory boards. Instead, the Atlas aspires to be a generalized interpretation of the zoning code which is comparable across municipal boundaries and amenable to updates and improvements over time.

Base Zoning Attributes


The attribute table for the base zoning layer of the Zoning Atlas has nearly 80 fields, which fall into the following categories:

  • Identifying information, which includes the name of the municipality, the name and abbreviation the municipality has assigned to that zone, and the standardized zone ID.
  • Use information, including fields that describe what uses are allowed in the zone, for example, whether multifamily housing (defined as 2+ units) is allowed by special permit or by-right.
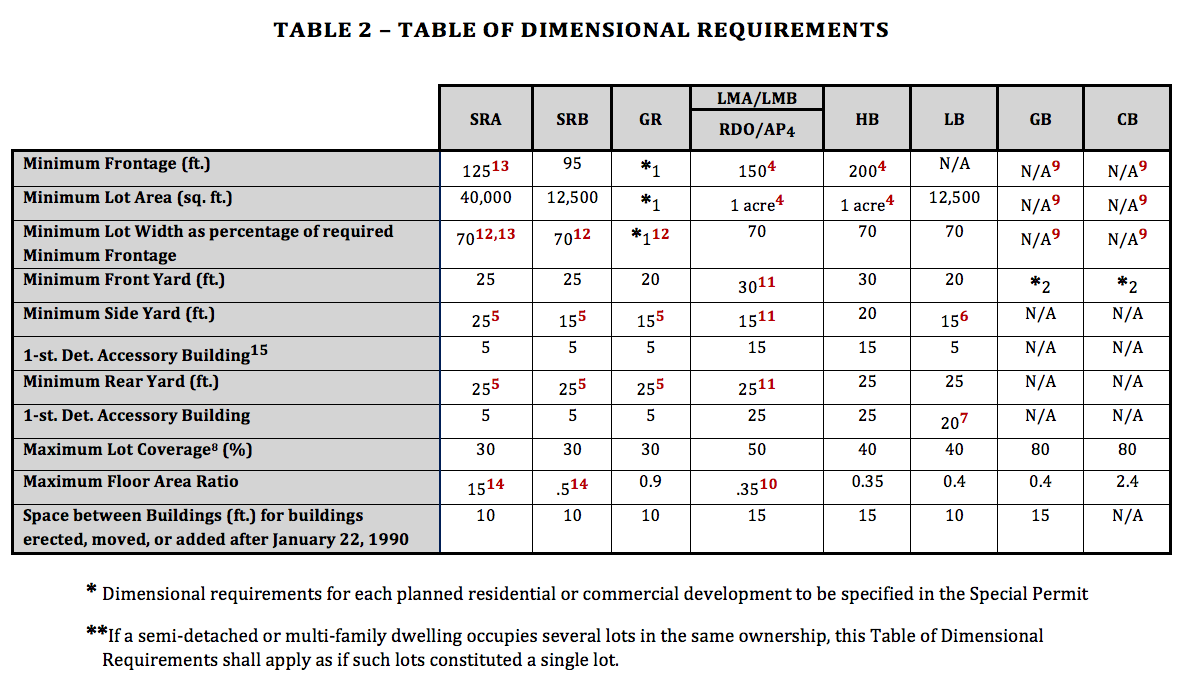
  • Dimensional regulations, including the core attributes of Minimum Lot Size, Maximum Height, Maximum Dwelling Units per Acre, and FAR. Since not all of these values are specified in the zoning code, this group of fields also includes other requirements more commonly specified and the intermediate calculations used by MAPC to arrive at the final estimates for each of the core attributes.
  • Text fields capture additional complexities about the regulations and additional details about our methods. For example, there is an open text field that pairs with each Override Value to record the reason one was needed.
  • Metadata, such as last edit date and revision history information.

Key attributes in the Zoning Atlas are summarized below. More details on how they were calculated is available in the technical appendix.

Zone Use Type (ZO_USETY): This field describes what uses – (1) Residential, (2) Non-residential, (3) Residential and Non-residential (mixed use), or (4) Open Space – are allowed in the zone by right, regardless of the zone name or zone description. Zone Use Type is populated for all zones in the Atlas.

Multifamily Fields (MULFAM2, MULFAM3_4, MULFAM5_19, MULFAM20_): This series of fields describes whether two, three to four, five to 19, and 20 or more residential units are allowed on a lot within a given zone, and if so, whether they are allowed by (1) Special Permit or (2) By right. It is currently the only field in the database that captures special permit information.

Minimum Lot Size (MINLOTSIZE): This field estimates the minimum lot area required for a developable parcel. Where multiple minimums are stated based on different uses, the recorded value corresponds to the use with the greatest allowable as-of-right density. MINLOTSIZE is populated for approximately 80% of the zones in the Atlas.

Maximum Percent Lot Coverage (PCTLOTCOV): This field specifies the maximum percent of the lot that can be covered by structures. As with the other dimensional regulations, the published value in the Atlas corresponds with the dimensional regulations of the greatest density use. PCTLOTCOV is populated for approximately 60% of the zones in the Atlas.

Minimum Land Area per Dwelling Unit (LApDU): This field specifies the minimum amount of lot area required for each dwelling unit. As with the other dimensional regulations, the published value in the Atlas corresponds with the dimensional regulations of the greatest density use, and maximum utilization of a lot. LApDU is populated for approximately 40% of the zones in the Atlas where residential development is allowed by right.

Maximum Building Height (MAXHEIGHT): This field specifies the maximum allowable building height in feet. As with the other dimensional regulations, the published value in the Atlas corresponds with the dimensional regulations of the greatest density use. MAXHEIGHT is populated for approximately 80% of the zones in the Atlas.

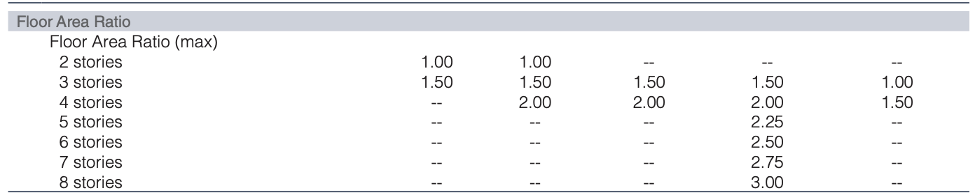
Maximum Building Floors (MAXFLRS): This field specifies the maximum allowable building floors, or stories. As with the other dimensional regulations, the published value in the Atlas corresponds with the dimensional regulations of the greatest density use. MAXFLRS is populated for approximately 50% of the zones in the Atlas.

Maximum Dwelling Units (MAXDU): This field describes the maximum number of dwelling units allowed on a lot by right. As with the other dimensional regulations, the published value in the Atlas corresponds with the dimensional regulations of the greatest density use. MAXDU is populated for approximately 50% of the zones in the Atlas where residential development is allowed by right.

Dwelling Units per Acre (DUpAC): This field is an estimate of the maximum allowable housing density in terms of dwelling units per acre. DUpAC is based on actual zoning specifications for approximately 20% of the zones in the Atlas where residential development is allowed by right, and has been estimated for an additional 70% of such zones.

Floor area Ratio (FAR): This field estimates the maximum FAR allowed in a zone by right. It is either reported (based on zoning code) or estimated for approximately 40% of all districts.

In the base zoning attribute table, there are actually multiple attributes that correspond to each of the measures described above, including values sourced directly from the zoning code, those that are estimated from other values, and those that are asserted based on analyst interpretation. There are also fields that describe how the final estimate was made and an "effective value" that represents MAPC's best estimate based on the information collected and analysis conducted.

For more detail on how the fields were calculated, please see the technical appendix.

Observations


MAPC's multi-year review of municipal zoning yielded many observations about the nature of land use regulation in the region. Many of these observations are consistent with those articulated by Amy Dain in her review of multifamily zoning. One clear conclusion is that zoning codes in Metro Boston are dizzyingly complex. Each city and town writes its own zoning according to its own rules and system. This makes interpreting them across municipalities very challenging. Whether one is a developer, advocate, or regional planner, understanding what is permitted where and under what circumstances is an arduous task.

Additionally, as municipalities update their codes, they often layer modifications over existing laws, creating a patchwork of rules and parameters that make interpretation even harder. Rarely do municipalities undertake a complete "recodification" of their zoning that would reconcile all the many overlapping modifications, redundancies, and conflicts.

Another challenge to interpreting and standardizing municipal zoning codes is that there are many terms within the general land use lexicon that have no standard definition, and that municipalities may interpret differently. The terms multifamily, accessory dwelling unit, and percent lot coverage, for example, may refer to slightly different things in different municipalities. Most of the time municipalities will include a definitions section that explains specific terms, or will describe specifications in detail within the document, but there are cases in which these or similar terms are used without further explanation.

This tangle is compounded by the wide variety of repositories and formats for zoning codes, ranging from PDF files or Microsoft Word documents posted on the municipal website to HTML pages hosted by third-party providers such as Municode. Some municipalities even post the zoning text as a scanned document, hampering users' ability to search, copy, or quote the code itself. The lack of standard formats and definitions for zoning codes renders local bylaws and ordinances largely inaccessible and opaque to those without abundant time to find and parse the zoning text.

Whether by accident or intention, only a minority of municipalities publish their zoning in an electronic format that is readily accessible by taxpayers and other stakeholders. Ten municipalities gave no response to our request for spatial zoning data. As noted previously, Rob Goodspeed's research found that more than half of municipalities statewide charge for access to digital zoning or parcel data solicited through a public records request, sometimes more than $450.

Goodspeed also found that many municipalities "placed legal restrictions on the data through licensing that could chill or prohibit creative reuses of the information through emerging technologies." In extreme cases, municipalities refused to release existing data altogether, claiming that such digital data was exempt from public records requests, an assertion that has no basis in the law.

Put simply, current practices with regard to municipal zoning generally run counter to the principles of government transparency and equitable engagement. They also provide unfair advantage to developers, attorneys, or realtors with inside knowledge and relationships, while disadvantaging those who have not previously worked in a given community. This is especially true for developers seeking to build much-needed workforce and affordable housing in suburban towns, where byzantine regulatory pathways stand between a proposal and a building permit. It's no wonder so many developers opt for a comprehensive permit to build multifamily housing.

The difficulties of gaining access to electronic zoning data also hinder the understanding of local zoning. Even as a regional public agency, we had trouble getting municipalities to provide data in a timely manner. Some never did so.

Part of the challenge of accessing zoning data stems from the limited capacity of municipalities to maintain and publish electronic GIS records. Zoning changes, including the creation of new districts and the modification of existing district boundaries, are commonly authorized by changes to the text of the bylaw or ordinance itself. These changes must then be translated into new district boundaries on the zoning map itself, a task that may become an afterthought. In many cases, the available spatial data lags one or more revisions behind the code, if it is published at all. Six municipalities that have updated their zoning since 1999 did not make corresponding updates to their electronic zoning map. Additional barriers exist for those municipalities that don't even have direct access to their own zoning data, having outsourced the maintenance of the electronic records to consultants who may charge a fee for each change or record request.

It doesn't help that most municipalities consider the paper zoning maps to be the "official" record of district boundaries, despite electronic zoning data offering far greater utility for municipal staff, project proponents, and resident stakeholders. This observation alone neatly summarizes the state of municipal zoning in Massachusetts today, which seems to emphasize historical precedent and discretionary decision-making over modern systems and predictability.

What's Next


The Zoning Atlas will always be a work in progress. The initial release is admittedly incomplete and undoubtedly contains imperfect interpretation of local codes. Yet it is an essential framework that can be filled in and refined over time to create a more complete representation of the region's land use controls. MAPC will dedicate resources to maintaining the data and web portal, and will also continue to collect and incorporate new and better data, contingent on available funding. MAPC is also harvesting the Zoning Atlas for insight about municipal zoning policies. In 2021, we will be releasing a series of reports examining regional patterns in multifamily housing policies, commercial development capacity, and zoning around transit stations.

The Atlas is designed to accept additions and corrections from users: the broader community of municipal staff and other knowledgeable stakeholders can contribute to its improvement. There is a mechanism for users to correct erroneous values, add missing information, and provide data about new or missing districts. MAPC will validate all submissions before incorporating them into the Atlas. In this way, a community of users can help to complete and maintain the work, with MAPC as a lead and steward.

MAPC will also work to enhance the Atlas itself to make it a more useful resource. We hope to receive feedback about how to improve the dataset or suggestions about features that might make the online publication more robust and useful. Improvements might include additional data fields or descriptors, changes in the data structure, information about discretionary processes, or the addition of contextual layers on the map, such as transit station areas, Environmental Justice populations, data on new developments, and more. We cannot promise new features right away, but we appreciate feedback as we make decisions about how to improve, update, and maintain the site.

Of course, the contents of the Atlas will need to be updated over time. Zoning boundaries and regulations evolve. Municipalities update their zoning. As we have discussed, there is no comprehensive reporting mechanism for municipalities to share their zoning information with a state or regional database. Our goal is that MAPC's Zoning Atlas can, at least until there is a statewide policy, serve as that central repository. However, it should not serve that purpose indefinitely.

There are many practical and efficient steps that could be taken to improve the consistency and availability of zoning data across the region. Over the coming years, MAPC will be working with member municipalities, stakeholders, and legislators to advance state and local actions toward that goal.

Recommendations


It is no surprise that, with all the complexities that we encountered in creating this Zoning Atlas, it has taken two decades for any state or regional entity to collect and publish a multi-municipal collection of zoning information. There are a number of ways that we propose this process could be made more efficient, but each of them requires the coordinated efforts among the region's municipalities. For a resource as important to the future of Greater Boston as a compendium of zoning regulations, we hope that municipalities are open to updating their methods where appropriate with the following recommendations.

A. Improving and maintaining the Zoning Atlas

Until a statewide standard for publishing and reporting zoning information exists, MAPC is committed to maintaining the Zoning Atlas, and, to the best of our ability, incorporating the stakeholder feedback that we receive. In the spirit of transparency, data stewardship, and municipal collaboration, we hope that our municipal partners throughout the region will find the Zoning Atlas a useful resource and will help us to keep it as true to form as possible by submitting their feedback and data updates.

Municipal staff and boards are encouraged to review the district boundaries, designations, and numerical attributes for the zones in their community, and to submit corrections and updates to MAPC.

MAPC, with the support of its member municipalities and funders, will maintain and improve the Zoning Atlas data infrastructure, content, and website.

B. Municipal data management

The technical and staff capacity of municipalities in Greater Boston to develop, manage, and update electronic versions of their zoning maps varies widely. There is also a wide range of political and policy commitment toward that effort. After all, it does demand some resources. GIS data management requires training that not every municipal staff person has, and time that municipal staff often lack. Yet zoning is fundamental to the fabric of a municipality, just like roads and pipes, all of which are mapped and inventoried. For many municipalities, zoning data does not yet exist in an updatable electronic format. These cities and towns will need assistance (and resources) to bring their zoning up to a standard where it can be maintained efficiently over time. Even more municipalities will benefit from support for maintenance of the data, through incentives or collectively procured and cost-effective consultant assistance.

Planning Boards should adopt a policy to create and maintain a GIS representation of the zoning district boundaries to serve as the definitive legal version of the municipality's district boundaries. At the very least, GIS data should be consistent and contemporaneous with the published zoning bylaw or ordinance.

MAPC or another lead agency can support this effort by convening a stakeholder group (municipalities, state agencies, GIS consultants, industry and advocacy organizations) to further assess the current state of practice; examine the systems that exist in other states; and establish and maintain a data standard for spatial zoning data. This data standard would specify particular fields, data formats, levels of accuracy, and other parameters for storing electronic forms of zoning district boundaries. (The standardization of zoning codes is another matter entirely and is addressed elsewhere in our recommendations.)

The Commonwealth should provide financial support for MassGIS, RPAs, or consultants to provide technical assistance to municipalities that need to bring their data into consistency with the established spatial data standard – and then keep it there. The support could be modeled off the Level 3 Parcel initiative, which ensured that all municipal parcel and assessor data met minimum format and quality standards. As with parcels, the Commonwealth can also provide strong incentives to encourage municipalities to keep that data current.

MAPC, along with other RPAs and partner organizations, should further investigate the state of practice with regard to zoning data maintenance and the use of consultants. This information can inform a collective procurement process that would provide municipalities with qualified, cost-effective technical assistance for zoning data maintenance.

C. Publishing and Reporting

Not only should zoning data be maintained in an electronic format, but it should also be made available to the public with the same access and regularity as the bylaws or ordinances. Once current spatial data is available, it should be accessible to humans and machines. This means published as a downloadable dataset, interactive web viewer, and made available through an application programing interface (API). This will enable all users and stakeholders to access accurate data from any location, expanding data transparency and resiliency.

Our efforts found that achieving that level of transparency may require a cultural and bureaucratic shift in some municipalities that have official policies or effective practices that limit public access to zoning data. Legal guidance and, if necessary, intervention from state officials may be necessary to shift these attitudes.

Along with publishing data locally, there is a need for a regular process to contribute zoning updates to a central repository such as the Zoning Atlas. While cities and towns are statutorily required to notify RPAs of proposed zoning changes, very few municipalities actually do so, and the notifications that are provided have very little information. Towns must submit approved zoning changes to the Attorney General for review, but district boundaries are not part of that submittal, much less in electronic format.

In the interest of transparency and informed engagement, municipalities should publish the GIS version of their zoning boundaries online, in a format accessible to viewers and users. The ideal would be for every municipality to make this information available as an interactive map that could be explored on their website, with a download and/or API option so that stakeholders may access as a public resource. The published data should be accompanied by metadata specifying its origin, including the corresponding ordinance or bylaw.

MAPC (or other partner organizations) should research and develop guidance on the legal obligation to make zoning data available as a public record. This guidance could also examine whether and how electronic records can be designated as the official district boundaries.

State agencies can designate an official repository for electronic zoning data—whether the Zoning Atlas or another data storage option—and could incentivize or even require municipalities to provide updated files when zoning district boundary changes are adopted.

Provision of zoning changes to RPAs should be encouraged and, if need be, enforced. This would enable RPAs to keep track of and update zoning information throughout their regions, enabling more effective tracking and comparison of municipal codes, as well as the sharing of best practices.

D. Code Structure and Standardization

Zoning district boundaries, even in electronic format, are only part of the puzzle. The regulatory information described in a municipality's zoning bylaws or ordinance fills in the details about what can or can't be built in any zone. Yet, extracting information from these documents can be very hard to do, depending on how the codes are structured. As we described earlier in this report, zoning codes vary widely in the way they are presented and the information they contain. This makes it difficult to produced standardized district information, even when all data are available. Some of the barriers could be overcome without making any substantive change to the zoning or publication method. For example, if there were a standard practice of presenting dimensional restrictions in a tabular format (rather than narrative), municipalities could make this change rather easily while providing great benefit to those seeking to find particular standards.

Given the diversity of local contexts and strong sense of local autonomy throughout Massachusetts, it will require a considerable amount of political will to move to a system in which all municipal zoning adheres to a standardized format, making such a vision hard to achieve in the near future. However, it may be more feasible to establish a set of core attributes and encourage municipalities to report or estimate the equivalent values for each district. For example, if maximum dwelling units per acre were one such core attribute, then a municipality could report the value equivalent to their actual regulatory measure (such as 40,000 square feet minimum lot size for single family homes). Where a strict equivalent is not available, a municipality could provide an estimate, much as MAPC has done in this process. The difference, of course, is whether MAPC is making those calculations and assumptions, or a municipal staff person familiar with the details and applications of the subject district.

Over time, the Commonwealth should consider the pros and cons of establishing standard definitions and structures for zoning bylaws, so that they are more readily comparable. Examination of how zoning is regulated in other states should be a core element of this process.

MAPC and/or other partners should engage municipalities and other stakeholders in a process to assess the feasibility of establishing a set of "core attributes" and populating these fields with information from the zoning codes (or validating the estimates presented in the Zoning Atlas).

Glossary of Terms


  • As of right - (see by right)
  • Base zoning - the principal zoning districts established by a municipality, covering the entirety of the municipality without overlap among districts.
  • By right - allowed according to zoning regulations; does not require any discretion­ary action by the zoning regulatory body.
  • Code - the collection of laws passed by a local governing body; in Massachusetts, cities refer to their codes as ordinances and towns as bylaws; zoning is one set of laws within a municipality’s code.
  • Floor Area Ratio (FAR) - floor area ratio (FAR), or the ratio of floor area of a building to the lot area of the parcel in which it sits, is a metric for regulating the number of square feet that can be developed on a parcel without specifying the exact shape and size of the building.
  • GIS - geographic information system; a framework for gathering, managing, and analyzing spatial data.
  • Overlay districts - areas overlapping base zoning districts that add further detail to or change regulatory specifics of the underlying districts; these districts may overlap each other and don’t have to cover the entirety of a municipality; some municipalities don’t have any overlay districts at all.
  • Zoning bylaw - a municipal law that outlines permitted uses and dimensional restrictions for various sections of land; specific to towns (for cities see zoning ordinance).
  • Zoning ordinance - a municipal law that outlines permitted uses and dimensional restrictions for various sections of land; specific to cities (for towns see zoning bylaw).
  • Special permit - a discretionary action subject to review and approval by the zoning regulatory body in a municipality that allows for a use, dimension, or development type outside of those allowed by-right according to the zoning code.